Python Projects
Python Skills
- Used
pandasfor data wrangling:dropna(),groupby(),pivot_table(),merge() - Performed EDA using
describe(),value_counts(), and correlation analysis - Cleaned and formatted dates, strings, and categorical variables with
str.replace(),pd.to_datetime(), etc. - Built visualisations with
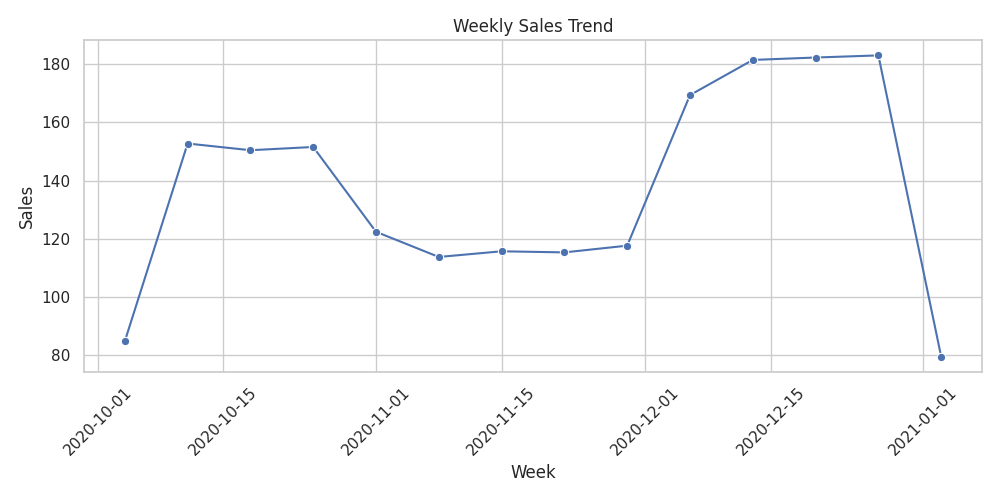
matplotlibandseabornincluding boxplots, heatmaps, and time series plots - Generated trend insights using resampling:
resample('W'),rolling(),diff() - Applied statistical measures: mean, median, standard deviation, skewness, and kurtosis
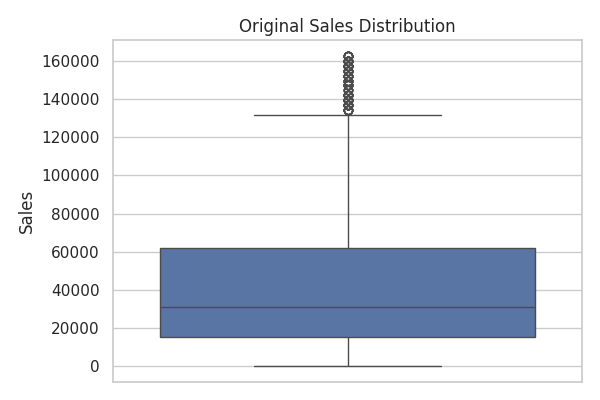
- Detected and handled outliers using IQR method and z-scores
- Used
loc,iloc, and boolean indexing for advanced filtering and slicing - Exported analysis-ready data to Excel, CSV, or SQL databases
- Documented workflows with Jupyter Notebook markdown and code comments
Sales Analysis – Python Project
This project explores apparel sales data in Australia during Q4 2020. Below is a step-by-step breakdown of the workflow including data cleaning, exploration, and insights using Python.
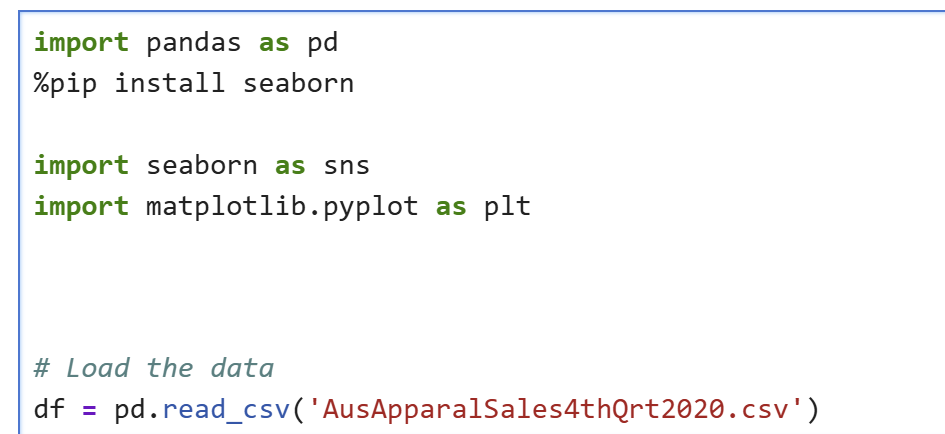
1. Load Dataset
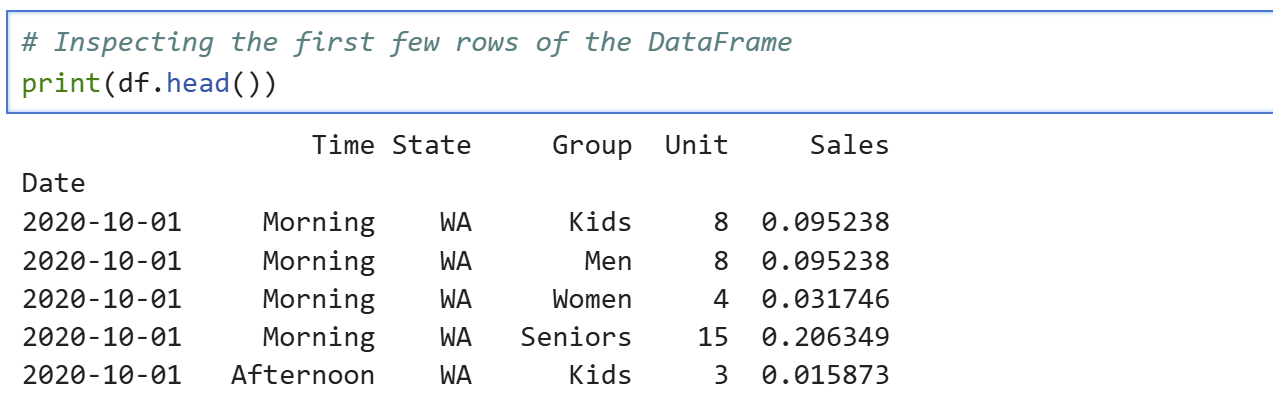
2. Preview Data
3. DataFrame Info
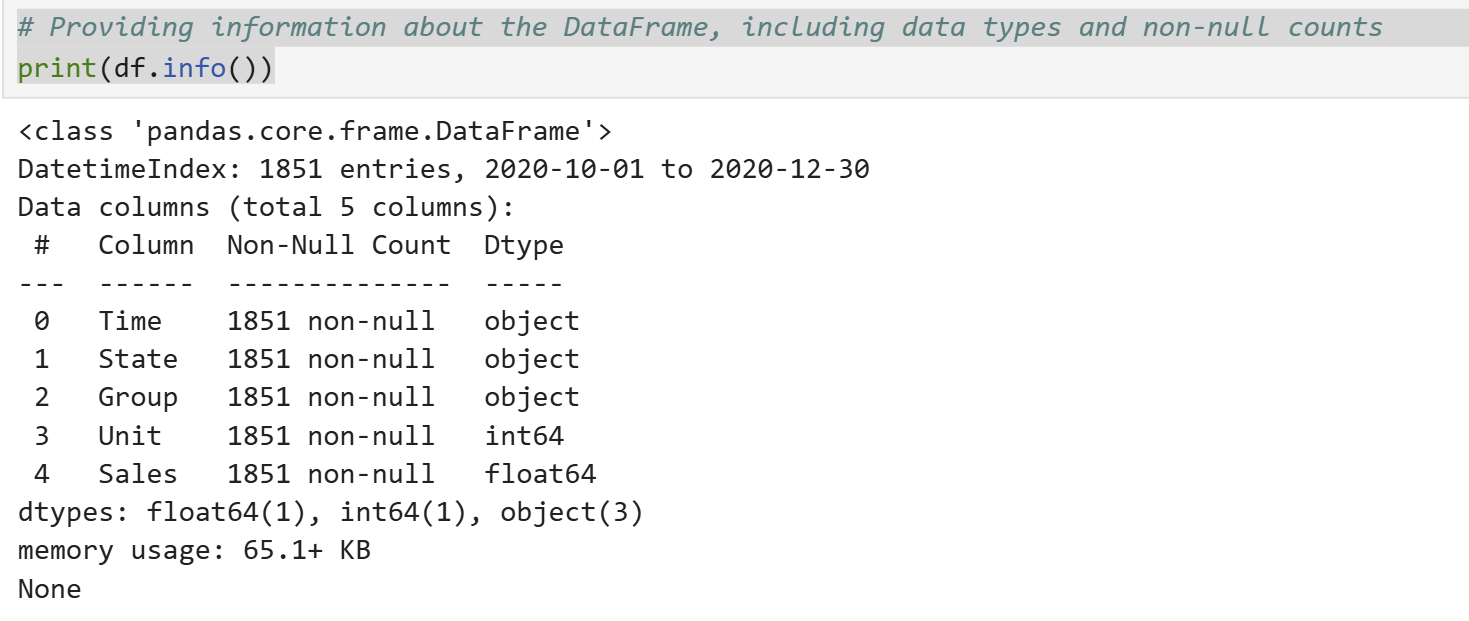
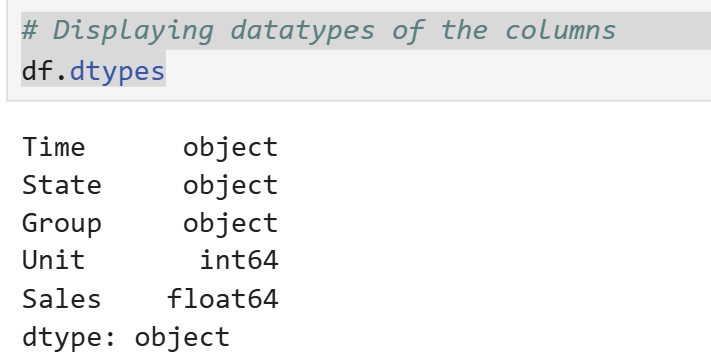
4. Data Types
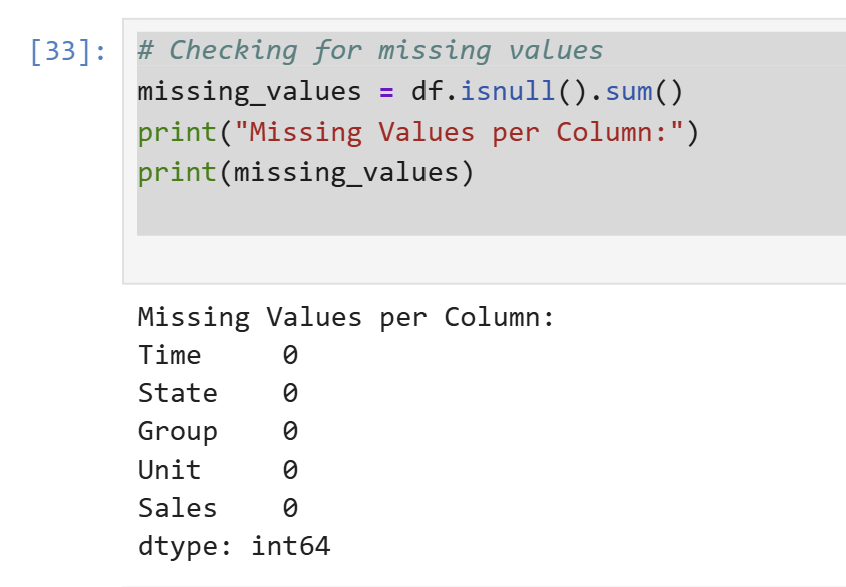
5. Nulls Check
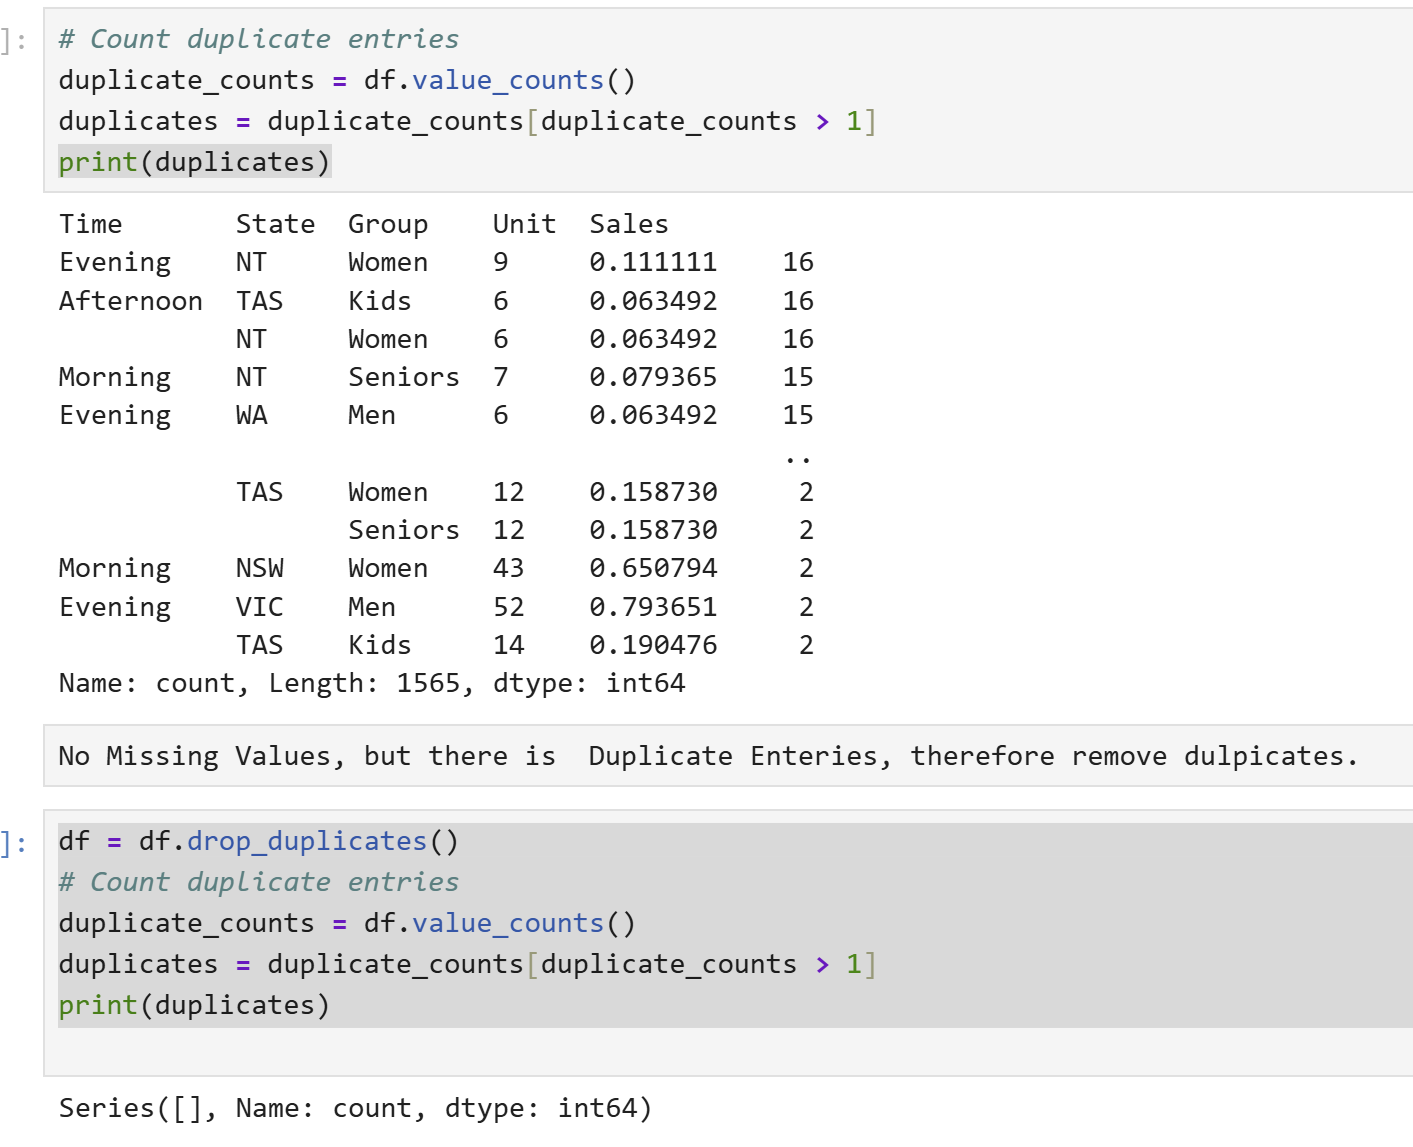
6. Duplicates Check
7. Boxplot of Sales
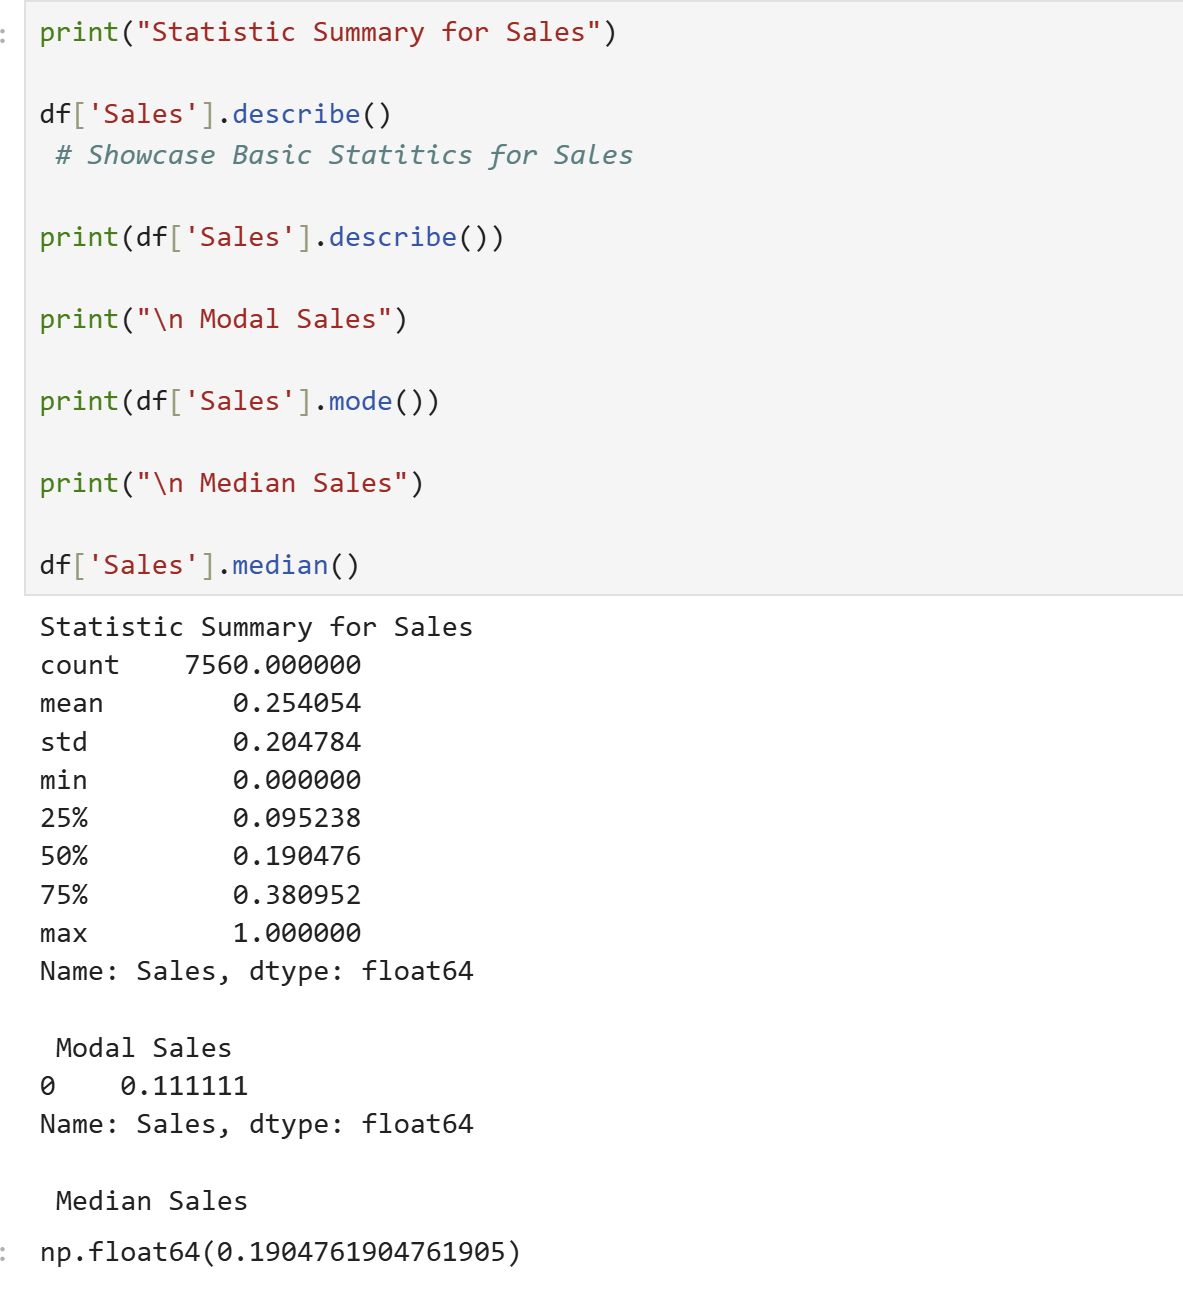
8. Summary Statistics
9. Weekly Sales Trend