Power BI Projects
Power BI Skills
- Designed interactive dashboards using slicers, filters, bookmarks, and drill-through functionality
- Created calculated columns and custom measures using DAX (e.g.,
CALCULATE(),FILTER(),SWITCH()) - Connected to data sources including Excel, SQL Server, Snowflake, and web APIs
- Built efficient data models using star schemas, relationships, and column reduction techniques
- Applied row-level security (RLS) to control user access to sensitive data
- Used Power Query (M Language) for data cleansing, transformation, and appending
- Optimised performance with data model tuning, query folding, and relationship filtering
- Implemented dynamic titles, tooltips, and conditional formatting for improved UX
- Created mobile-optimised reports for access on the go
- Integrated Power BI with Microsoft Excel, Teams, and SharePoint for collaboration
- Published reports to the Power BI Service and scheduled data refreshes
- Created paginated reports and exports for regulatory or compliance reporting
- Used Power BI to visualise KPIs, trends, forecasts, and variance analysis
PPI Claims Dashboard
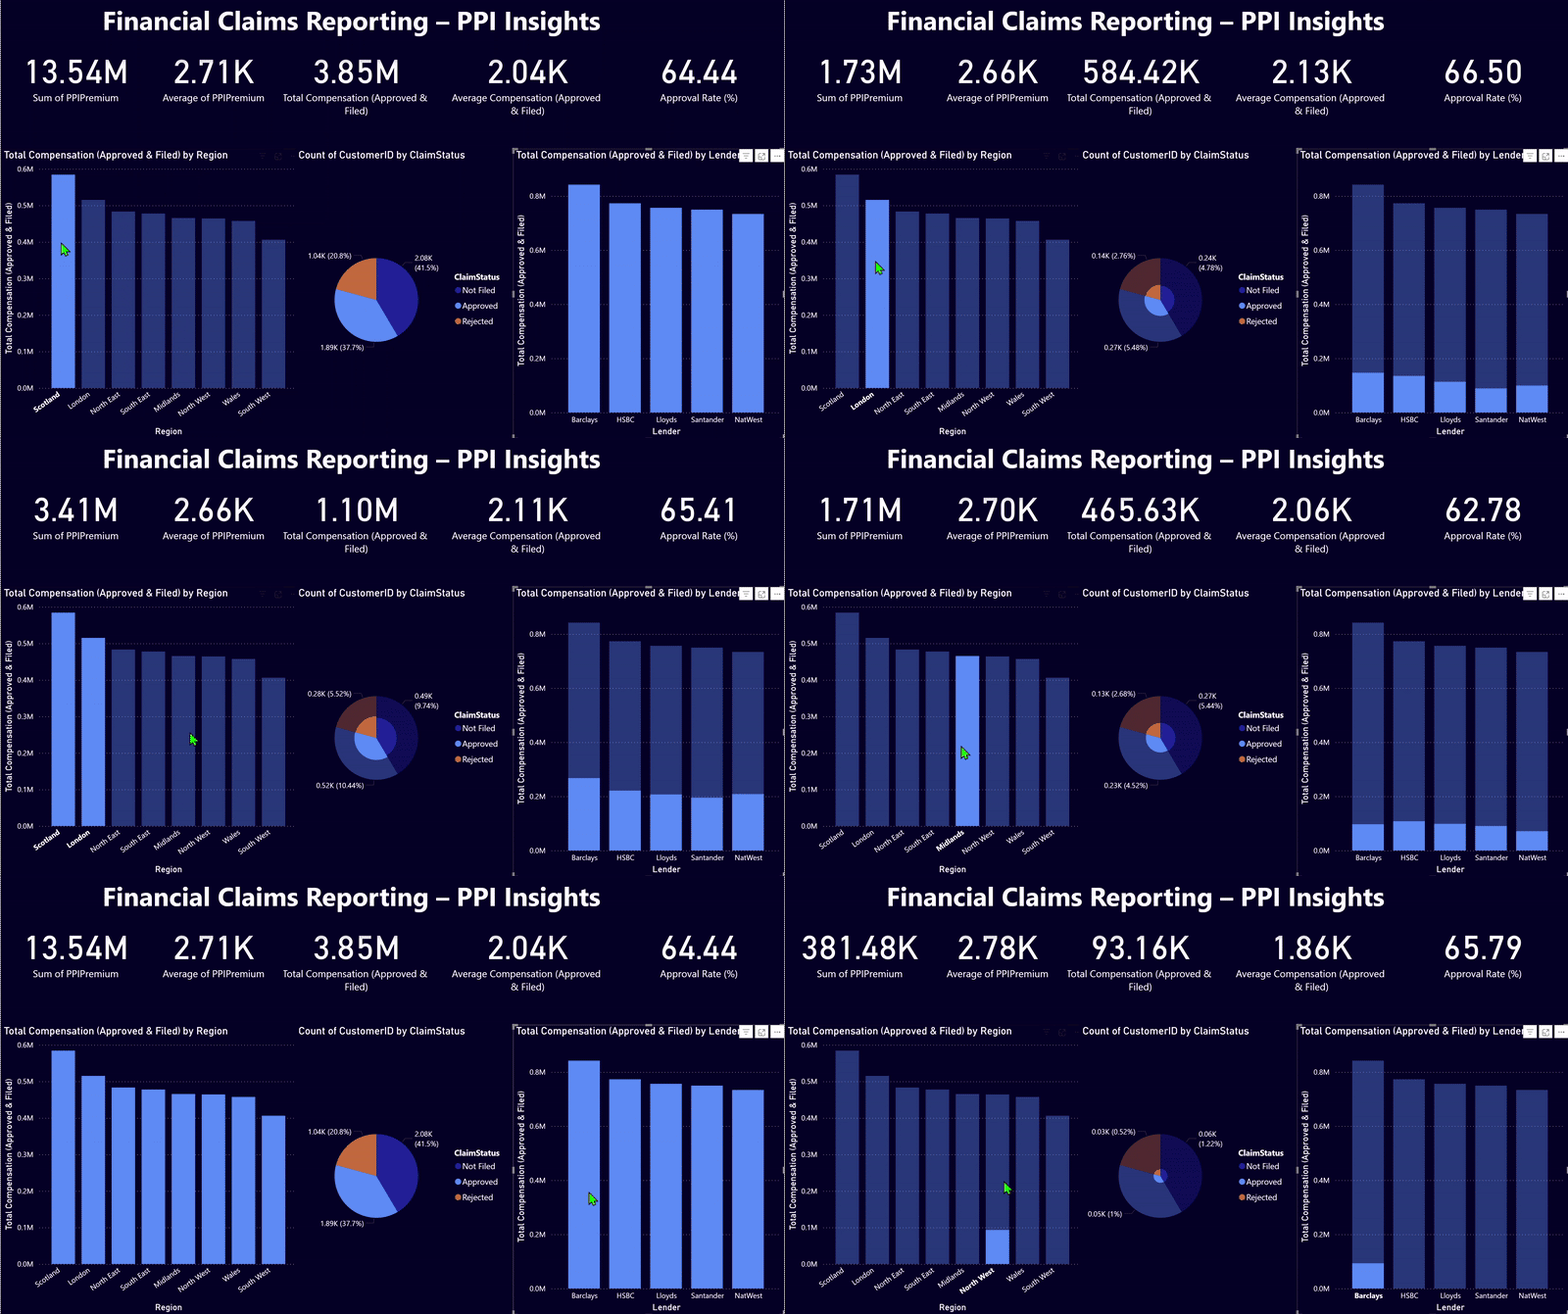
This Power BI dashboard visualises a Payment Protection Insurance (PPI) claims dataset. It was built using Power BI and connected to a Snowflake SQL pipeline. It provides actionable insights for finance and operations stakeholders.
- Tool: Power BI + Snowflake SQL
- Visuals: KPI cards, bar charts, pie charts, maps
- Metrics: Total Compensation, Approval Rate, Claims Filed, Regional Analysis
- Audience: Finance Director, Claims Operations Manager